

📈 Market Pulse: Big Improvements, But Caution Still Warranted

This past week brought some notable strength to equity markets, with both US and European stocks showing meaningful improvement in trend scores. But let’s not get ahead of ourselves just yet — while the data is promising, short-term signals suggest we could see a bit of a breather first. Let's dive in 👇
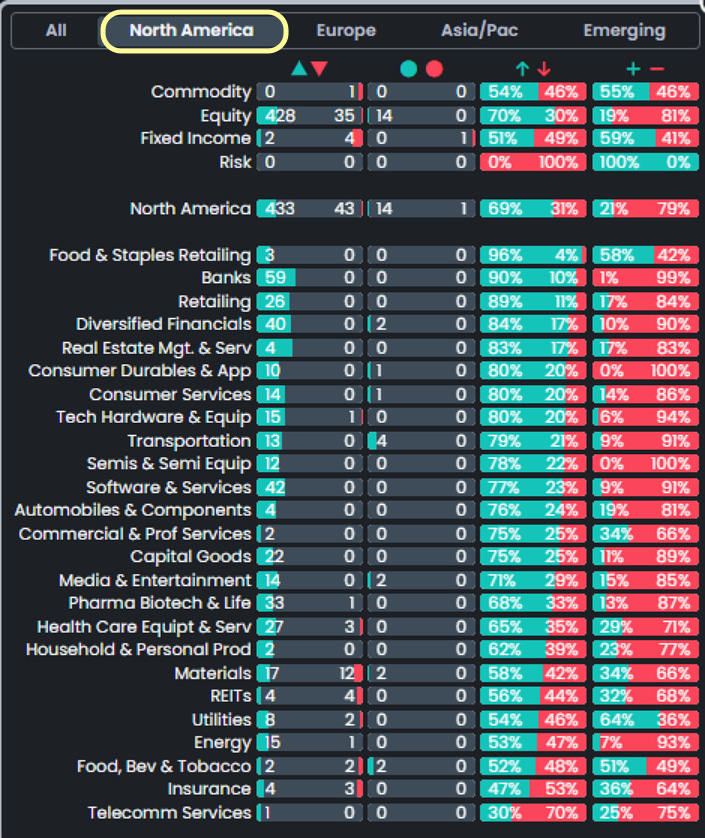
US Equities – Scores Getting Better, But Not All Clear Yet
The underlying health of the market is improving — that’s the good news ✅. Over 800 stocks in the S&P 500 have triggered positive weekly reversal signals, and index-level scores are ticking higher, especially on the short-term daily timeframe.
🔄 However, in the very short term, over 200 S&P stocks are now stretched above their daily Bollinger Bands. That often signals a market needing to pause or consolidate.
🟢 Nasdaq is leading the charge, with a confirmed positive reversal on the weekly chart and daily scores trending higher.
📊 Here’s what the risk/reward setup looks like:
S&P 500: Support @ 5550 (📉 -2.4%), Resistance @ 5990 (📈)
Nasdaq: Support @ 19,510 (📉 -2.7%), with resistance levels still developing
MAGS ETF: Wider trading band with Support (📉 -2.7%) vs Resistance (📈 +9%)
Overall, the setup shows a decent +6% upside vs ~2% downside risk for the indices. Not bad — but be prepared for short-term chop.
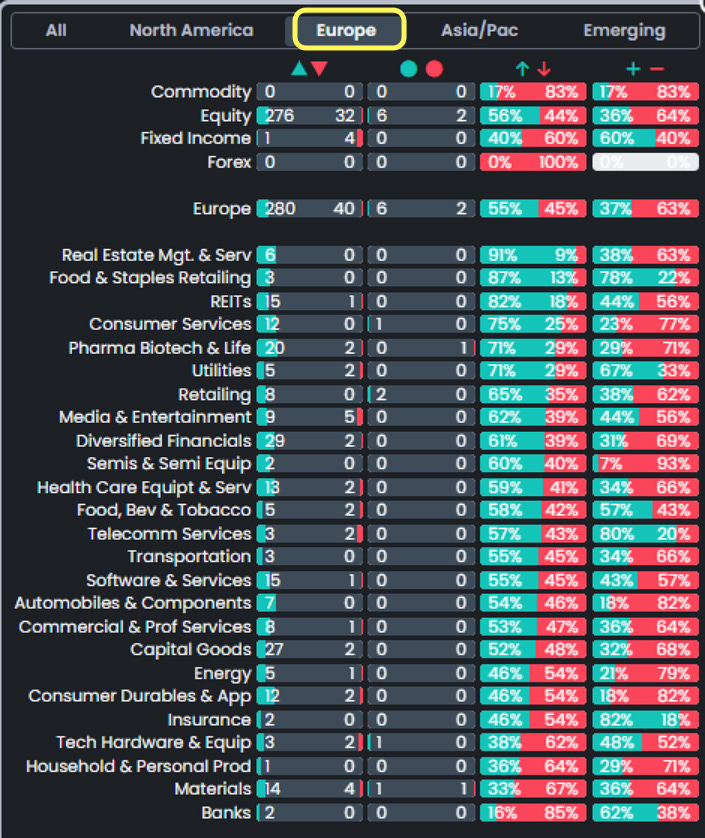
European Equities – Strong Week, But Watch Resistance
European stocks also had a solid week, with the Stoxx 600 up over 3% 🚀. The charts are starting to echo the US setup — strength building, but no confirmed trend reversals yet.
💡 120 of the 600 Stoxx names have triggered individual positive signals.
📈 Momentum is picking up:
73% of daily scores are accelerating
52% of weekly scores are strengthening
⚠️ Near-term, the Stoxx 50 is a bit stretched and may need to cool off:
Support: 📉 -2.5% below current levels
Resistance: 📈 +4.5% higher
🧠 What This Means for the Week Ahead
The trend improvements, especially at the weekly signal level, are hard to ignore — these signals tend to last around 50 days, with some stretching out over 100+ days.
But...with so many stocks stretched above daily bands, there’s a good chance we’ll see some early week volatility as things rebalance. Remember, daily moves often play out over ~10 days, so short-term pullbacks may offer fresh entry points.
Thanks for reading! 🧠📊 Stay tuned and stay sharp — we’ll be watching the data closely as it unfolds.