

Positive Momentum Carries Into the 4th of July
But Is Exhaustion Looming? 🔍

As we head into the U.S. Independence Day holiday, equity markets continue to show signs of resilience and strength 💪. On a short-term basis, 63% of S&P 500 constituents have advancing scores, with an even more impressive 82% of scores currently registering as positive ✅. This aligns with the generally upbeat sentiment we’ve seen through the early summer ☀️.
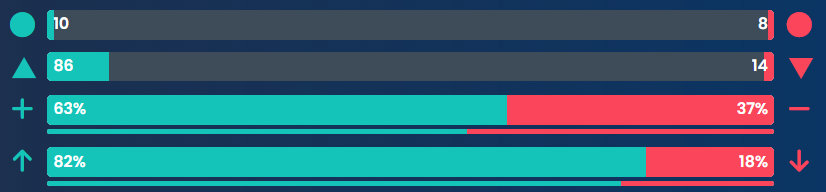
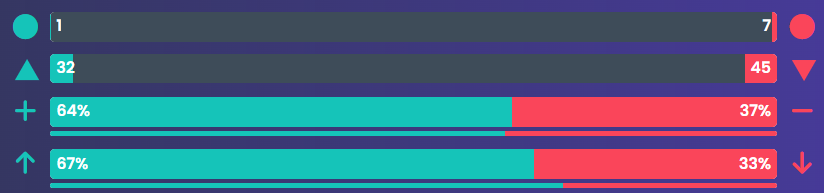
Looking at the medium-term (weekly timeframe), the picture remains constructive: 64% of stocks are advancing, and 67% have positive scores 📈. Momentum is broad-based, and the participation suggests underlying strength — though we remain watchful for signs of exhaustion ⚠️.
Any early signs of topping are most likely to appear in the daily data before surfacing in the weekly. Given the seasonality and the upcoming holiday lull 🧨, any such shift may not become evident until post–4th of July trading resumes in earnest next week 📅.
📊 Positioning Relative to Volatility Bands
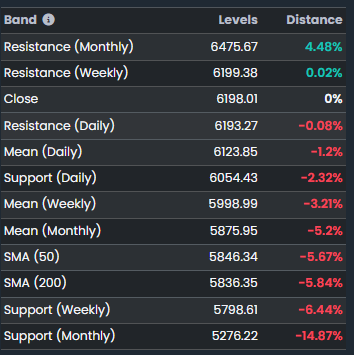
Here’s where the broader market sits relative to key volatility bands:
The index closed at 6198.01, just 0.02% below weekly resistance (6199.38) and slightly above daily resistance (6193.27). This suggests the market is pushing into key resistance levels 🧱, testing the upper edge of recent ranges.
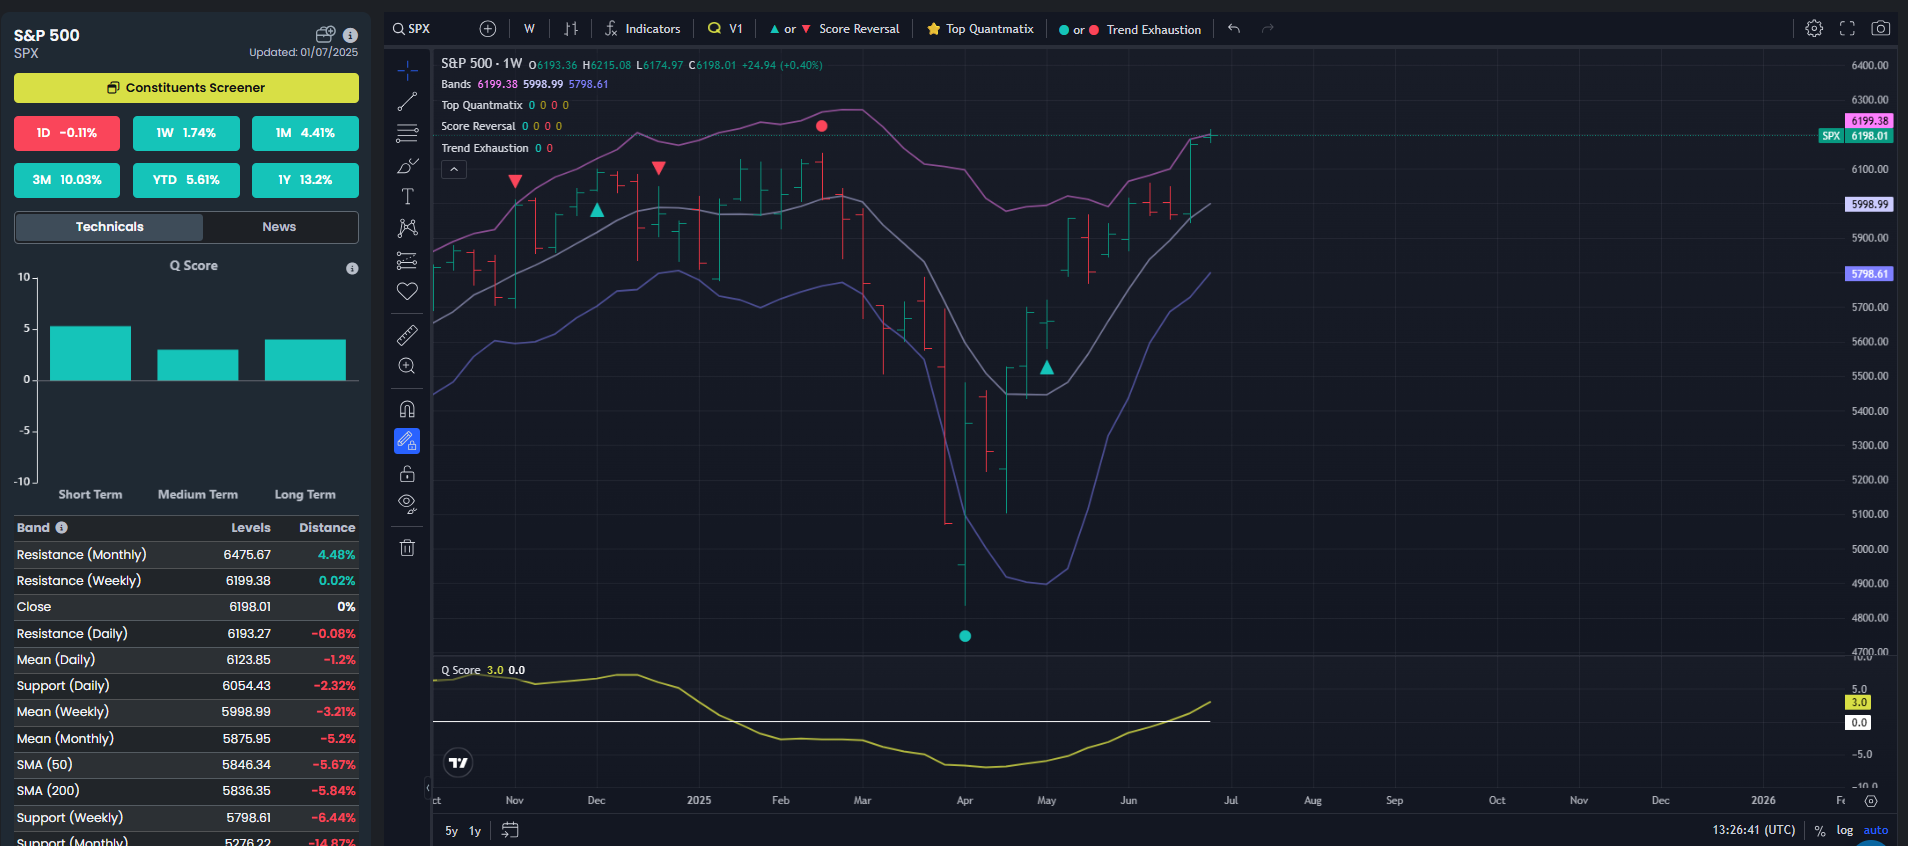
The monthly resistance at 6475.67 remains 4.48% higher 🚀, offering further room to the upside if bullish momentum continues.
On the downside, immediate daily support lies at 6054.43 (–2.32%). Further supports include:
📌 Summary: The market is near-term extended but still comfortably supported across multiple timeframes. The proximity to resistance suggests a potential pause or consolidation, while the broad-based positive momentum provides a supportive backdrop beneath 🔄.
We’ll be monitoring closely for any signs of divergence or fatigue — especially in the daily trends — as the post-holiday session unfolds. Stay tuned and enjoy the holiday! 🎇📉📈