


When the Chips Cool.....
Across the 613 technology companies our models score every night, the most arresting reading this week is not in a single stock — it is at the very top of the market, all at once. Every one of the mega-caps that led global equities for the better part of two years is now easing back together. Of the 613 names, roughly 400 are declining and only around 213 are rising; in semiconductors, just 12 of 126 names are still advancing. And the weakness is not scattered: it is thickest, and fastest, along one stretch of the map — the semiconductor supply chain.
Quantmatix grades roughly 10,000 instruments on a single scale every night, from deeply beaten up to stretched after a long run — the Google Maps for markets. Open it, and an entire sector’s turning points light up together. This week the semiconductor chain lights up in one direction: memory, silicon wafers, chip-making equipment, packaging and test, all deteriorating at the same time. The handful of corners turning higher sit a long way from the top.
The market is not walking away from technology. It is easing back from the parts that ran the hardest, and looking again at the parts it had left for dead.
It started in memory. On 13 July, South Korea’s SK Hynix fell around 15% in a single session — its largest one-day drop on record, as reported by Barron’s and The Times — with Samsung Electronics off about 10.7% and the Korean market down close to 9%. Investing.com reported the tremor running straight up the chain, with ASML, ASM International and Seagate each off around 5%. Memory is the most commoditised, most cyclical corner of the chip world; when it cracks, the wafers, tools and packaging that feed it tend to follow. On our map, they did — and the Korean memory names have simply kept falling since, day after day, with no turn yet in sight.
And it is the whole chain, not one weak link. That is what lifts this above an ordinary wobble. The chip-making equipment makers, the silicon-wafer suppliers, the analog and power specialists, the packaging-and-test houses and the domestic device makers of Asia are all deteriorating in step. When only the odd name slips, it is noise; when every link of a supply chain softens together, from the tools at one end to the finished device at the other, it usually reflects the market pricing a slowdown in the whole build-out, not a single product cycle. One name stood clearly apart from the gloom — TSMC, the leading-edge foundry behind the most advanced AI chips, held firm — a reminder that even in a hard week the market can still tell quality from commodity.
Then the Fed put a name to it. In his first congressional testimony (14–15 July), Fed Chair Kevin Warsh said AI-infrastructure investment is showing early signs of supply-chain overcapacity — particularly in memory semiconductors and related components. He acknowledged AI’s productivity benefits, but cautioned that investment is outpacing commercialisation, and that not every AI project will justify current market valuations. The remarks were followed by renewed weakness in memory and semiconductor stocks and a lower Nasdaq 100 (Bloomberg, WSJ, Fox Business). It is not every week that the chair of the Federal Reserve and a quantitative model point at exactly the same corner of the market within the same few days.
The most expensive software is coming off the boil. The second stretched corner sits far from the chip world: the premium cyber-security and cloud names that had their best quarter on record this spring. CNBC reported two of the marquee names up roughly 95% and 113% between April and June; Yahoo Finance and TradingView put them at around 150 and 290 times forward earnings, with the average analyst price target already below the current price. These are the richest-scored names in the entire market on our scale, and the first small turns are beginning to show even as their share prices have kept climbing. A turn from a level this stretched can prove a pullback within a strong run as easily as the start of a reversal — the signal marks the first move, not the destination — but at these valuations there is little room for disappointment.
And a quiet corner is turning up. The constructive part of the map is the group that spent the past year being written off: beaten-up, cash-generative software — the steady, everyday kind rather than anything speculative — and the big IT-services firms. That sector, Reuters noted, was down around 28% this year before this month’s earnings began to beat expectations on banking demand and AI work. The recovery is narrow but genuinely global: it shows in the United States, in Europe’s smaller software names, and most clearly in Asia, where India and Israel are the only two countries on our map with every single turn this week pointing upward. Green shoots tend to appear first exactly where the ground was hardest.
One result told the whole story in miniature. IBM fell about 24.5% after a poor set of numbers — described by Livemint as its worst single-day fall since 1968 — and it pulled the market two ways at once. The same result weighed on the Indian IT names that supply and compete with it, while IBM’s own warning about rising cyber threats was cited as a spur for the very security-software names already trading at nosebleed multiples. One event; two opposite effects. That is what a selective market looks like, as opposed to one that is simply heavy across the board.
The honest part. The upward turns are the minority — closer to fifty, against roughly seventy-five to the downside — in a market where two-thirds of names are declining. This is a market picking survivors, not lifting a sector. Every turn is a single night’s reading that the next session has to confirm, and model estimates are exactly that — estimates, not promises.
What to watch next. The near-term test is the mega-cap earnings season: reassurance there could steady the chip names, while another disappointment would confirm the softening the map is already showing. The earliest all-clear would be a first turn higher in Korean memory — the purest downtrend in the book, and the place this all began. Until then, the shape of the map is clear enough to say plainly: the leaders are cooling, the chip machine is deteriorating from memory outward, and the first signs of life are in the names the market had given up on. The map redraws itself every night. We will keep reading it, and keep reporting what it shows.
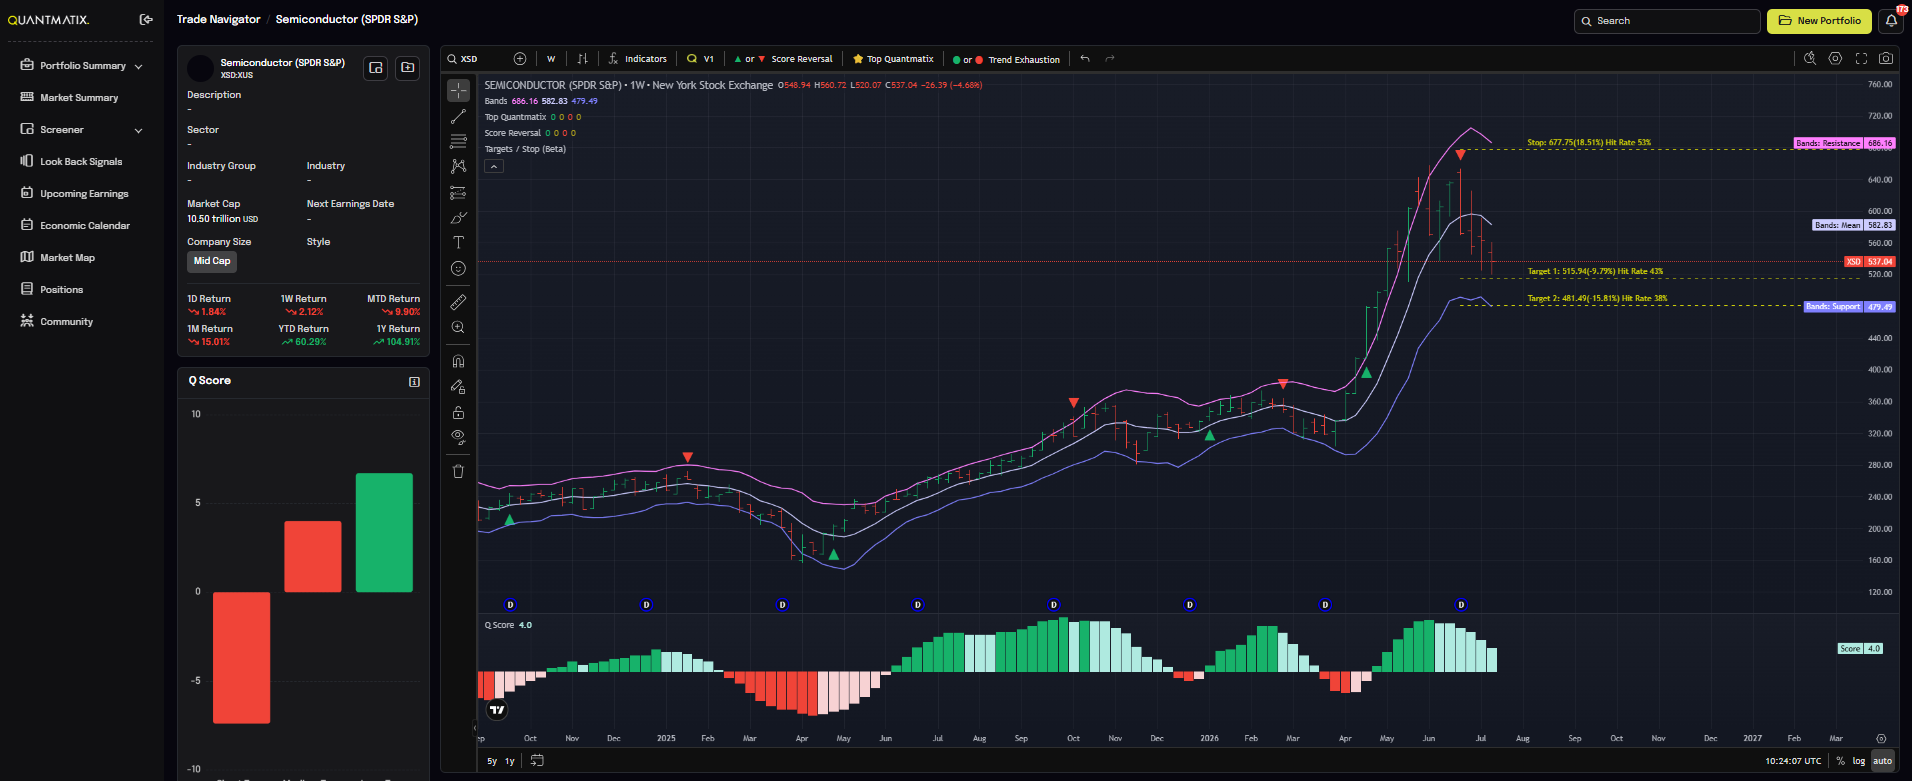
(XSD - US Semi conductor chart)
The full analysis of all the individual stocks with Scores, Signals, Price Targets and Stop losses as well as earnings forecasts and earnings calendars is available on the Quantmatix Web App for Subscribers.
From chaos to conviction. That's Quantmatix. If this is the read you want every week — the whole market mapped, the turns flagged early, and every theme ranked nightly across a 10,000-instrument universe — here is how to get it: ▸ Subscribe to the full research at quantmatix.com ▸ Follow & subscribe to this newsletter for the weekly map ▸ Talk to us — Liam.Boggan@quantmatix.com · enterprise & institutional: Colm.Gaughran@quantmatix.com
Follow our LinkedIn for updates on research - Quantmatix Markets
Disclosure. Produced by Quantmatix Global Research (author: Liam Boggan). This article is general market commentary for information only. It does not name individual securities as Quantmatix signals and does not constitute investment advice, a personal recommendation, or an offer or solicitation to buy or sell any financial instrument. Any companies referred to are mentioned solely as factual market or news context, drawn from public reporting dated 6–15 July 2026 (Barron's, The Times, Investing.com, Bloomberg, WSJ, Fox Business, CNBC, Reuters and Livemint) and not independently verified by Quantmatix. Aggregate figures describe the output of Quantmatix quantitative models. Past performance is not indicative of future results. Quantmatix is not authorised to provide investment advice under MiFID II. Quantmatix, its employees or associated persons may hold positions in securities referenced in public reporting. © Quantmatix 2026. All rights reserved.